I'm reading an ebook about Excel and it has excercises in it.
But the following excercise is confusing for me. Here's what it says:
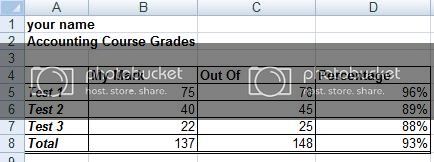
1. "Recreate the following data set. Be sure to copy the font and border formatting as shown in the graphic.*Did that, see atached file please*"
2. *This is the confusing part*"Enter the appropriate formulas/functions to complete the empty cells for totals and percentages, and ensure that the number format is set to 'no decimal places'"
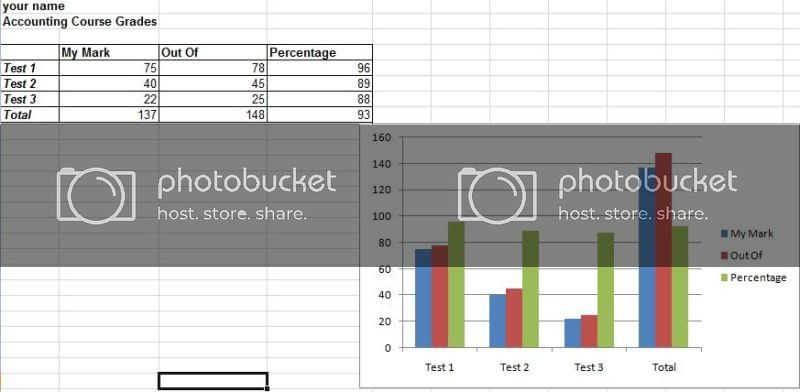
3. *This part as not confusing, but the question is 'All of the data?'* "Make a column chart to illustrate the data"
With the percentage column formatted as number - percent, it does not show up too well on a chart.
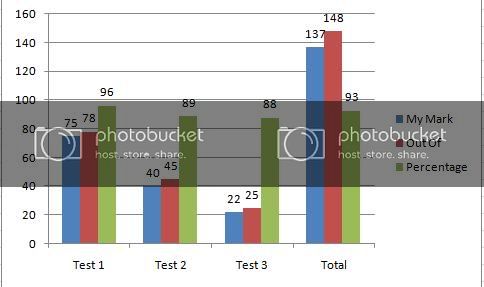
If you change that column to a format - number - number, then you can have the values calculated as for example, =(B5/C5)*100 etc instead of the straight B5/C5 then it shows up properly in a chart.
Then maybe add data labels to the chart for easier reading.
Last edited by General Winters; July 27th, 2009 at 01:04 PM.


 Reply With Quote